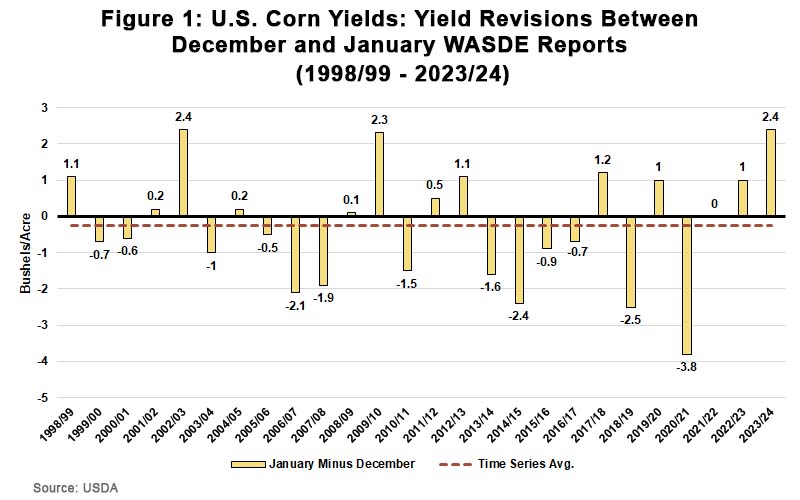
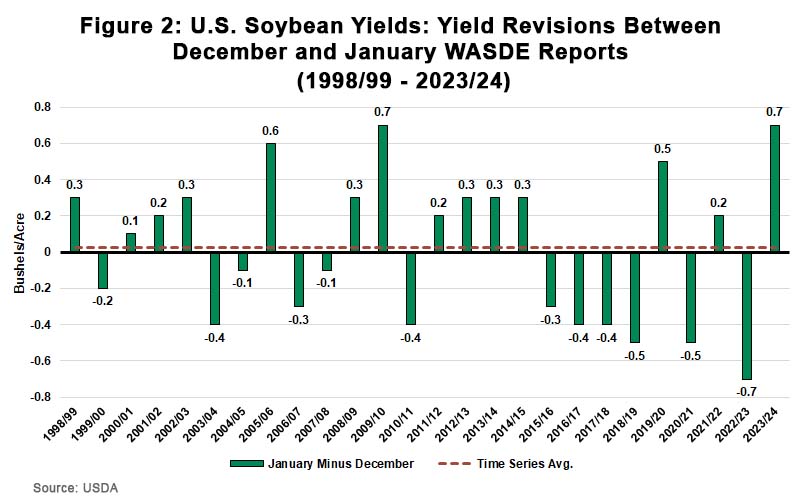
USDA revised 2023 yields for U.S. crops in its January WASDE. Final corn yield for U.S. growers is 177.3 bushels per acre, up 2.4 bushels from 174.9 bushels per acre in December. Soybeans came in at 50.6 bushels per acre, up from 49.9 bushels per acre at the close of 2023.
Ahead of the report, markets left corn yields unchanged from December and soybeans down 0.1. The corn and soybean yield revisions in the January WASDE were bearish to the market. December 2024 corn opened the day at $4.89 per bushel and were down $0.08 to $4.81 later in the afternoon. November 2024 soybeans were $12.07 per bushel to start the day and were down $0.06 to $12.01 per bushel later in the afternoon. Nearby futures were also down for both commodities.
USDA generally adjusts corn and soybean yields from the December to the January WASDE. But during the past 25 years, the change for corn has been minimal, ranging from 3.8 fewer bushels in 2020/21 to an additional 2.4 bushels in 2002/03. On average, the change is -0.4 bushels. The January WASDE revision for corn yield was the highest revision since 2002/03.
Soybeans are similar, moving 0.7 bushels up or down during the same 25-year period. The January WASDE revision for U.S. soybean yields was the highest seen since 2009/10.
We could see further revisions to U.S. yields. But moving forward, all eyes will be on South America, where USDA projected lower corn and soybean production from Brazil, and slightly higher soybean production from Argentina. Growing conditions in Brazil have been challenging, and changes can shift market prices this time of year.
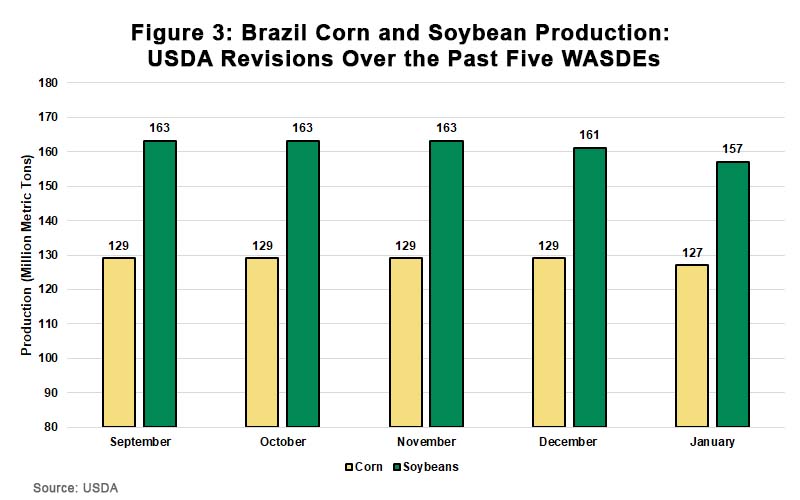
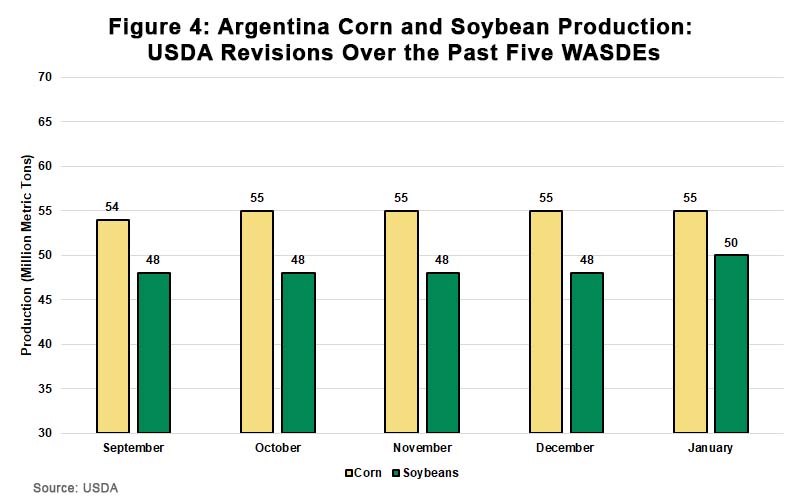
Generally, adjustments to the South American crop are more impactful to the market during this time of year. The central part of Brazil has been dry while the south has received excessive moisture. As a result, Brazil’s crop agency (CONAB) lowered its corn and soybean forecast for the new crop, leading USDA to do the same. As Figure 3 shows, USDA lowered Brazil corn and soybean production by 2 million metric tons (mmt) and 4 mmt, respectively. At the same time, as Figure 4 shows, USDA left Argentinian corn production the same while increasing soybean production by 2 mmt due to favorable rains. Figures 3 and 4 show month-to-month reductions by USDA WASDE to Brazil and Argentina’s new corn and soybean crops.
Markets ahead of the report anticipated USDA would lower world ending stocks for corn and soybeans. Instead, USDA increased world corn ending stocks to 325.2 mmt, 11.3 mmt higher than the average pre-report market estimate. World ending stocks for soybeans also increased to 114.6 mmt, 2.4 mmt higher than the average pre-report market estimate. Both revisions were bearish for the corn and soybean market.
Leading up to U.S. planting season, South American weather generally headlines the corn and soybean market unless a black-swan type event occurs. This is particularly true for Brazil’s second and largest corn crop, or the safrinha corn crop, which is generally planted between January and February and harvested June through September.
Corn Outlook: Larger Production, Use, Ending Stocks
- USDA increased corn production 108 million bushels to a record 15.3 billion bushels due to higher corn yields of 177 bushels per acre.
- USDA revised upward two of the three major use categories. Feed and residual increased 25 million bushels to 5.675 billion and corn used for ethanol increased 50 million bushels to 5.375 billion. Exports were unchanged at 2.1 billion bushels.
- Supply jumped more than use. As a result, corn ending stocks increased 31 million bushels to 2.16 billion bushels, the highest since 2018/19.
What this means for corn producers
The January report was bearish for corn. USDA’s revision to corn yields from 174.9 to 177.3 bushels per acre was higher than the average pre-report estimate of 174.9 and outside the high end of the market’s range of 176 bushels per acre. The corn yield revision, which would result in record corn production, surprised the market, but was in line with anecdotes from producers harvesting a better-than-expected crop.
While USDA increased total usage by 75 million bushels, it wasn’t enough to offset supply increases of 106 million bushels. As a result, ending stocks are 25.4% above the 10-year average.
The stocks-to-use ratio for 2023/24 is 14.8%. This is 2.7 percentage points above the 10-year average and the highest since 2018/19. The projected season-average farm price was down to $4.80, lowered $0.05 per bushel from December’s estimate.
USDA’s upward revision of world ending stocks also was surprising news. Pre-report expectations averaged 313.9 million metric tons. But USDA increased world ending stocks to 325.2 million metric tons due to higher global production. If realized, this would be the highest level of world ending stocks since marketing year 2017/18. At the same time, the global stocks-to-use ratio jumped from 26.1% to 26.9% -- still 1.0 percentage points below the 10-year average. The January report shows the corn market is becoming more abundant.
Soybean Outlook: Increased Production, Higher Ending Stocks
- USDA increased 2023/24 soybean production by 36 million bushels to 4.165 billion. This was due to national average yields revised higher by 0.7 bushels to 50.6 bushels per acre.
- Total usage on the domestic balance sheet remained largely intact, with a slight reduction from the residual category. A record soybean crush of 2.3 billion bushels is still expected, while 2023/24 exports of U.S. soybeans are projected to be 10% below the 10-year average.
- Ending stocks were raised 35 million bushels to 280 million bushels, above the market’s expectation of 239 million bushels.
What this means for soybean producers
USDA’s revisions to the soybean balance sheet were bearish. Both USDA yield and ending stock projections were higher than market expectations: 50.6 bushels per acre vs. 49.8 and 280 million bushels vs. 239. Both revisions by USDA also were outside the high range of market’s expectations ahead of the report. The largest production increases came from Illinois, Missouri and North Dakota.
Despite upward revisions to production, the U.S. soybean balance sheet remains tight compared to the 10-year average. U.S. soybean ending stocks remain below their 10-year average by approximately 65 million bushels. The 2023/24 stocks-to-use ratio jumped nearly 1 percentage point from the December report – 6.7%, up from 5.9%. As a result of higher production levels, USDA lowered the average farm price by $0.15 per bushel to $12.75 per bushel.
The global supply-and-demand picture for soybeans included slight changes, but still ran counter to the market’s expectation heading into the report. Most notably, USDA revised global soybean ending stocks higher from 114.2 mmt to 114.6 mmt; pre-report, the market anticipated USDA would lower global soybean ending stocks to an average of 112.2 mmt. Higher production forecasts for Argentina, the United States, Russia, China, Paraguay and Bolivia are offset by the 4 mmt reduction from Brazil. Notably, due to abundant early-season rainfall in Argentina and Paraguay, USDA revised their soybean production levels by 2 mmt to 50 mmt and 0.3 mmt to 10.3 mmt, respectively.
The global stocks-to-use ratio increased slightly from December’s estimate of 29.5% to 29.7%. However, the global soybean situation continues to remain abundant.
Wheat Outlook: Lower Beginning and Ending Stocks, Unchanged Exports
- USDA lowered 2023/24 ending stocks by 11 million bushels to 648 million on decreased supplies that more than offset use.
- The global wheat outlook calls for larger supplies, consumption, trade and ending stocks compared to the December report.
- Global supplies were revised higher by 3.6 mmt to more than 1.056 billion due to higher beginning stocks and production. The increase in beginning stocks is primarily the result of revisions for Ukraine, where beginning stocks were raised 2.2 mmt to 3.5 mmt.
- Projected global ending stocks rose 1.8 mmt to 260 mmt due to increases from the European Union and Ukraine.
What this means for wheat producers?
The January report was a mixed bag for wheat: slightly bullish on the domestic balance sheet and slightly bearish on the global balance sheet. Globally, USDA’s upward revision to global ending stocks to 260 mmt was slightly above the market’s average expectation of 258.3 mmt. However, USDA’s revision was in the market’s pre-report range.
On the domestic balance sheet, USDA’s downward revision to ending stocks to 648 million bushels was less than the market’s average expectation of 658 million bushels but within the range of expectations.
USDA lowered the 2023/24 season-average farm price by $0.10 to $7.20 per bushel based on prices received to date and expectations for futures and cash prices for the remainder of the 2023/24 marketing year.
Due to USDA’s revision reducing ending stocks on the domestic balance sheet, the stocks-to-use ratio for 2023/24 U.S. wheat decreased to 34.5% in January, from 35% in December. The domestic balance sheet remains tight, and the 2023/24 stocks-to-use ratio is 8.3 percentage points below the 10-year average.
On the global front, world ending stocks continue to be at their lowest level since 2015/16. The global stocks-to-use ratio for 2023/24 stayed the same from the December WASDE at 32.6% remaining 2.9 percentage points below the 10-year average. The global wheat, like the domestic market, remains tight.
