Farmland values appear to have adjusted to a new normal. Even with seasonal fluctuations, farmland values have remained generally consistent since 2015.
“Farmland values are largely dependent on geography and have adjusted to reflect their market’s current supply and demand,” said Tim Koch, chief credit officer for Frontier Farm Credit, which tracks the values of 71 benchmark farms in association with Farm Credit Services of America (FCSAmerica).
Farmland values in FCSAmerica’s four states of Iowa, Nebraska, South Dakota and Wyoming peaked in the last half of 2013. Long-term data for eastern Kansas is not available because the alliance between Frontier Farm Credit and FCSAmerica dates only to 2015.
Nearly five years later, Iowa has seen the largest drop in values at 17.8 percent, followed by Nebraska at 17.6 percent. South Dakota’s farmland is off 10.8 percent since it peaked in the fourth quarter of 2013. (The five-year mark in the chart below reflects changes in farmland values since the first half of 2013, prior to the market peak. The number of benchmark farms in each state is noted in parentheses.)
| STATE |
Six Month |
One Year |
Five Year |
10 Year |
| Kansas (7) |
2.1% |
2.1% |
N/A |
N/A |
| Iowa (21) |
2.1 |
3.5 |
-16.3 |
71.4 |
| Nebraska (18) |
0.1 |
-2.8 |
-12.0 |
109.3 |
| South Dakota (23) |
-1.4 |
-2.6 |
4.2 |
98.6 |
| Wyoming (2) |
2.5 |
3.2 |
38.5 |
30.1 |
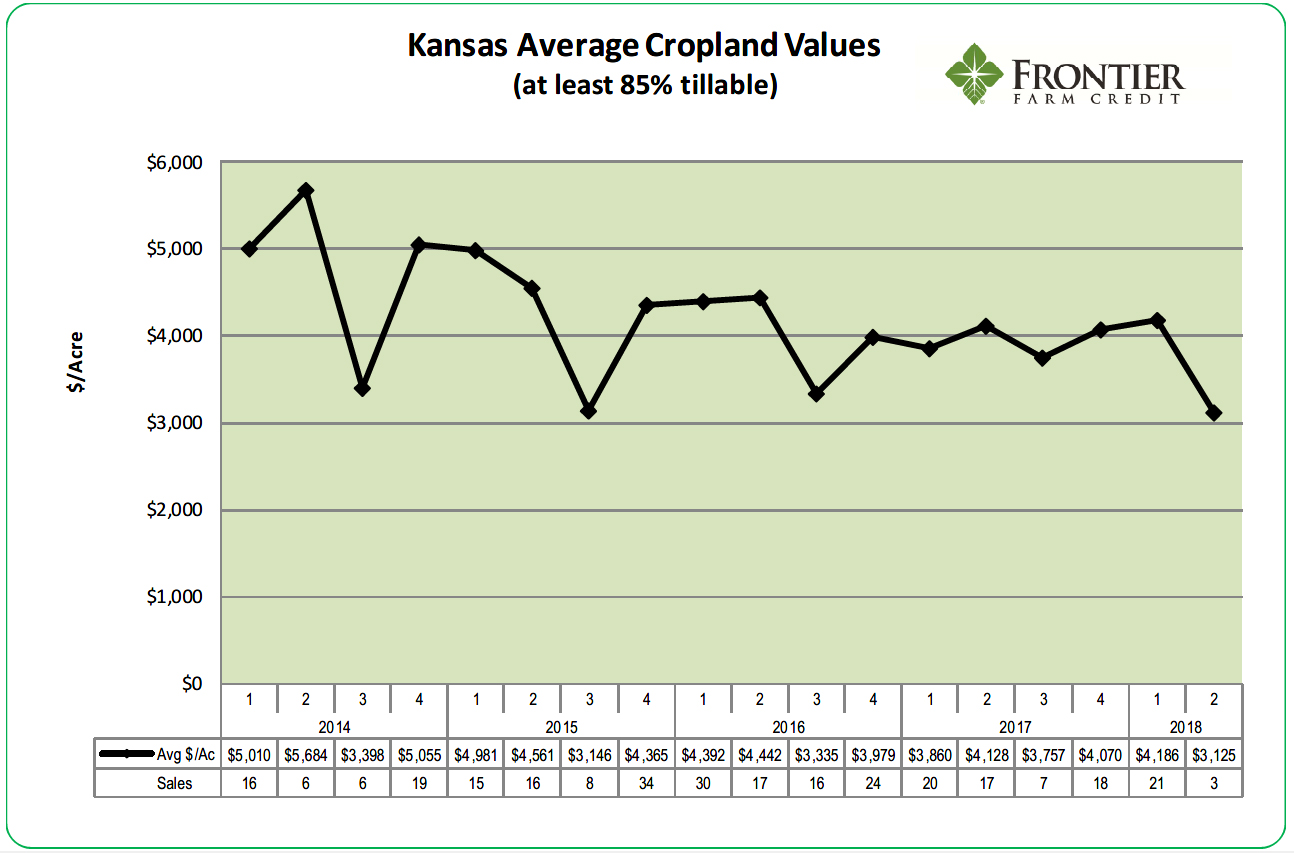
In the first half of 2018, four of the seven benchmark farms in eastern Kansas increased in value, two declined and one showed no change.
Frontier Farm Credit and FCSAmerica appraise benchmark farms twice a year, in January and July. In addition, the cooperatives compile records from farmland sale. The cooperatives’ objective in using the benchmark farms is to track real estate values without the influence of changes in land quality on sale prices. Below are quarter-by-quarter changes in sale prices for eastern Kansas: