Winter wheat heading has progressed from 63 percent to 72 percent for the week ended May 21, according to USDA. The average is 67 percent. Kansas wheat is still well ahead of its 83 percent average, at 94 percent.
The good/excellent rating in the 18 states reported increased by one point, to 52 percent, while the poor/very poor dropped by two pints from last week, to 15 percent. Kansas’ good/excellent rating also rose – by three points – from 44 percent to 47 percent. Its lower end dropped three points to 24 percent. Even with lower acreage, should this crop come in strong with good protein, it will leave holders of 2016’s lesser quality wheat wondering what to do with it.
Spring wheat now is 90 percent planted, compared with an average of 84 percent. Sixty-two percent has emerged in the six states USDA reports, 3 points ahead of average. The Dakotas and Minnesota are ahead in planting and emergence, while Idaho, Montana and Washington are behind their averages.
Planting Progress: One more week to finish
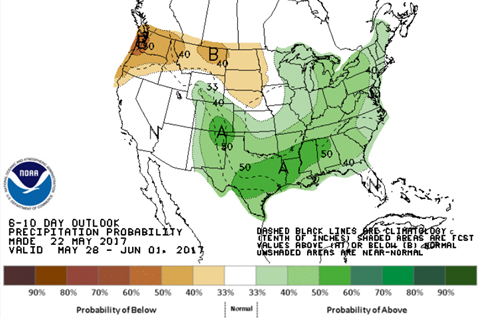
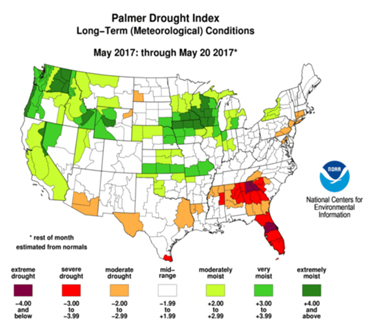
Most states are very close to complete on their corn planting. But the final dash may have to take place between rains. Not only are the next few days expected to deliver rain over much of the country, but the 6 to 10 day forecast, for May 28 to June 1 (left map), promises to add to the excess moisture in some regions (right map).
Corn Status
Nationally, USDA reports corn planting at 84 percent of the intended acres as of May 21, still just one percentage point behind the five-year average. With planned acreage of 90 million, that leaves just 14 million to go.
While Iowa and South Dakota remain ahead of average, Nebraska has fallen 4 points behind. Kansas now is a hefty 16 points behind its average – the most of any state.
However, some replanting may be needed in Iowa due to wet conditions in some spots, according to Farm Credit Services of America's Rod Hartwig. This is certainly in keeping with the excess moisture shown in the map above
Emergence also has fallen behind in the 18 states USDA tracks – and Nebraska’s crop is 10 points behind average. Michigan and Wisconsin also are far behind their usual emergence for this week.
Percent planted and emerged in the 18 states accounting for 92 percent of 2016 corn acres
|
Planted |
Emerged |
|
5/21/17 |
5-yr avg |
Difference (percentage points) |
5/21/17 |
5-yr avg |
Difference (percentage points) |
| USA |
84 |
85 |
-1 |
54 |
55 |
-1 |
| KS |
70 |
86 |
-16 |
48 |
58 |
-10 |
| IA |
92 |
90 |
2 |
59 |
59 |
0 |
| NE |
87 |
91 |
-4 |
52 |
57 |
-5 |
| SD |
88 |
84 |
4 |
47 |
43 |
4 |
| CO |
69 |
78 |
-9 |
35 |
41 |
-6 |
| IL |
89 |
90 |
-1 |
67 |
69 |
-2 |
| IN |
76 |
78 |
-2 |
45 |
52 |
-7 |
| KY |
83 |
82 |
-1 |
60 |
64 |
-4 |
| MI |
67 |
71 |
-4 |
16 |
34 |
-18 |
| MN |
94 |
86 |
12 |
59 |
53 |
6 |
| MO |
93 |
90 |
3 |
79 |
74 |
5 |
| NC |
96 |
97 |
-1 |
92 |
89 |
3 |
| ND |
82 |
73 |
9 |
38 |
31 |
7 |
| OH |
73 |
73 |
0 |
41 |
44 |
-3 |
| PA |
59 |
69 |
-10 |
30 |
38 |
8 |
| TN |
95 |
94 |
1 |
83 |
81 |
2 |
| TX |
87 |
86 |
1 |
76 |
75 |
1 |
| WI |
65 |
72 |
-7 |
21 |
32 |
-11 |
Data: USDA/NASS
Soybean status
Soybean planting has moved to 53 percent complete, 1 point ahead of average, though emergence is two points behind average. That leaves a more substantial 42 million acres yet to go.
With the exception of Iowa, Nebraska and South Dakota have fallen behind average both in planting and emergence. Emergence in southern states is well ahead of average but the cool weather isn’t helping the northern tier.
Percent planted and emerged in the 18 states accounting for 95 percent of 2016 soybean acres
|
Planted |
Emerged |
|
5/21/17 |
5-yr avg |
Difference (percentage points) |
5/21/17 |
5-yr avg |
Difference (percentage points) |
| USA |
53 |
52 |
1 |
19 |
21 |
-2 |
| KS |
27 |
34 |
-7 |
13 |
13 |
0 |
| IA |
62 |
60 |
2 |
15 |
17 |
-2 |
| NE |
52 |
61 |
-9 |
13 |
21 |
-8 |
| SD |
56 |
50 |
-6 |
11 |
13 |
-2 |
| AR |
74 |
60 |
14 |
62 |
47 |
15 |
| IL |
48 |
52 |
-4 |
18 |
23 |
-5 |
| IN |
47 |
50 |
-3 |
16 |
24 |
-8 |
| KY |
34 |
29 |
-5 |
13 |
14 |
-1 |
| LA |
91 |
80 |
11 |
84 |
65 |
19 |
| MI |
37 |
47 |
-10 |
0 |
16 |
-16 |
| MN |
72 |
62 |
10 |
16 |
20 |
-4 |
| MS |
86 |
74 |
8 |
77 |
58 |
19 |
| MO |
42 |
38 |
4 |
20 |
17 |
3 |
| NC |
36 |
32 |
4 |
19 |
15 |
4 |
| ND |
57 |
49 |
8 |
10 |
10 |
0 |
| OH |
43 |
47 |
-4 |
17 |
18 |
-1 |
| TN |
36 |
38 |
-2 |
15 |
19 |
-4 |
| WI |
29 |
43 |
-14 |
3 |
10 |
-7 |
Data: USDA/NASS
